
The Clinical Potential of Biomarkers in Atopic Dermatitis
Despite the common usage of biomarkers as a diagnostic tool in many chronic diseases, the diagnosis of atopic dermatitis (AD) remains dependent upon clinicians’ individual judgement and experience1. Without specific and objective laboratory findings aiding diagnosis, misdiagnosis has seemingly become a more serious issue1. It is therefore imperative to explore biomarkers of great clinical values for improving AD diagnosis and the management of the disease overall.
Unmet Needs in the Current Diagnosis Practice
At present, AD diagnosis is primarily based on physicians’ clinical evaluation complemented by different diagnostic criteria such as the Hanifin and Rajka criteria and the UK working party criteria on account of the absence of specific diagnostic laboratory marker1,2. While physical skin examination appears easy for trained and experienced clinicians, the deceptively normal non-lesional AD skin could still confuse abnormality identification and personal subjectiveness remains inevitable3. Even with the various AD diagnostic criteria, they may not be straightforward or streamlined enough especially in non-dermatologists’ perspective and their lack of specificity or sensitivity further limits clinical applicability1,4. Worse, a uniform understanding of this disorder has yet to be established, as highlighted by a 2019 survey revealing that 59 different operational definitions exist for AD diagnosis5.
Considering the lack of validated diagnostic criteria especially in the adult population and that some AD cases remain difficult to diagnose, a 2021 consensus statement from an expert panel of Italian clinicians has unanimously suggested that it is of utmost importance to identify a list of laboratory tests and reliable biomarkers useful for diagnosing difficult cases, stratifying disease severity and monitoring treatment efficacy6.
Preceding this consensus, however, around 30% of dermatologists have been using biomarkers, mainly immunoglobulin E (IgE) and eosinophils, for AD diagnosis, according to an online survey conducted by the International Eczema Council (IEC)3. That said, they are overall considered nonspecific biomarkers, given IgE’s weak correlation to AD severity and that eosinophilia is present only in some but not all AD patients7,8.
Thymus and Activation-regulated Chemokine as a Reliable Biomarker for AD
Thymus and activation-regulated chemokine (TARC), a CC chemokine constitutively expressed in the thymus and found on the keratinocytes of AD lesional skin, has been featured concordantly in the Italian expert consensus and an IEC review as the most substantiated biomarker of AD thus far, with both citing evidence from a 2015 meta-analysis conducted by Thijs et al3,6,8.
With 222 articles reporting 115 different biomarkers in over 30000 patients critically appraised, this meta-analysis has altogether identified TARC as the most reliable biomarker that can correlate significantly with AD severity, demonstrating pooled correlation coefficients of 0.60 (95% CI: 0.48-0.70) and 0.64 (95% CI: 0.57-0.70) in pooled longitudinal and cross-section studies analysis, respectively (Figure 1)8. Given these remarkable findings, the authors conclusively suggest that TARC holds the potential of being a biomarker valuable for assessing not only the severity of AD but also the course of the disease8.
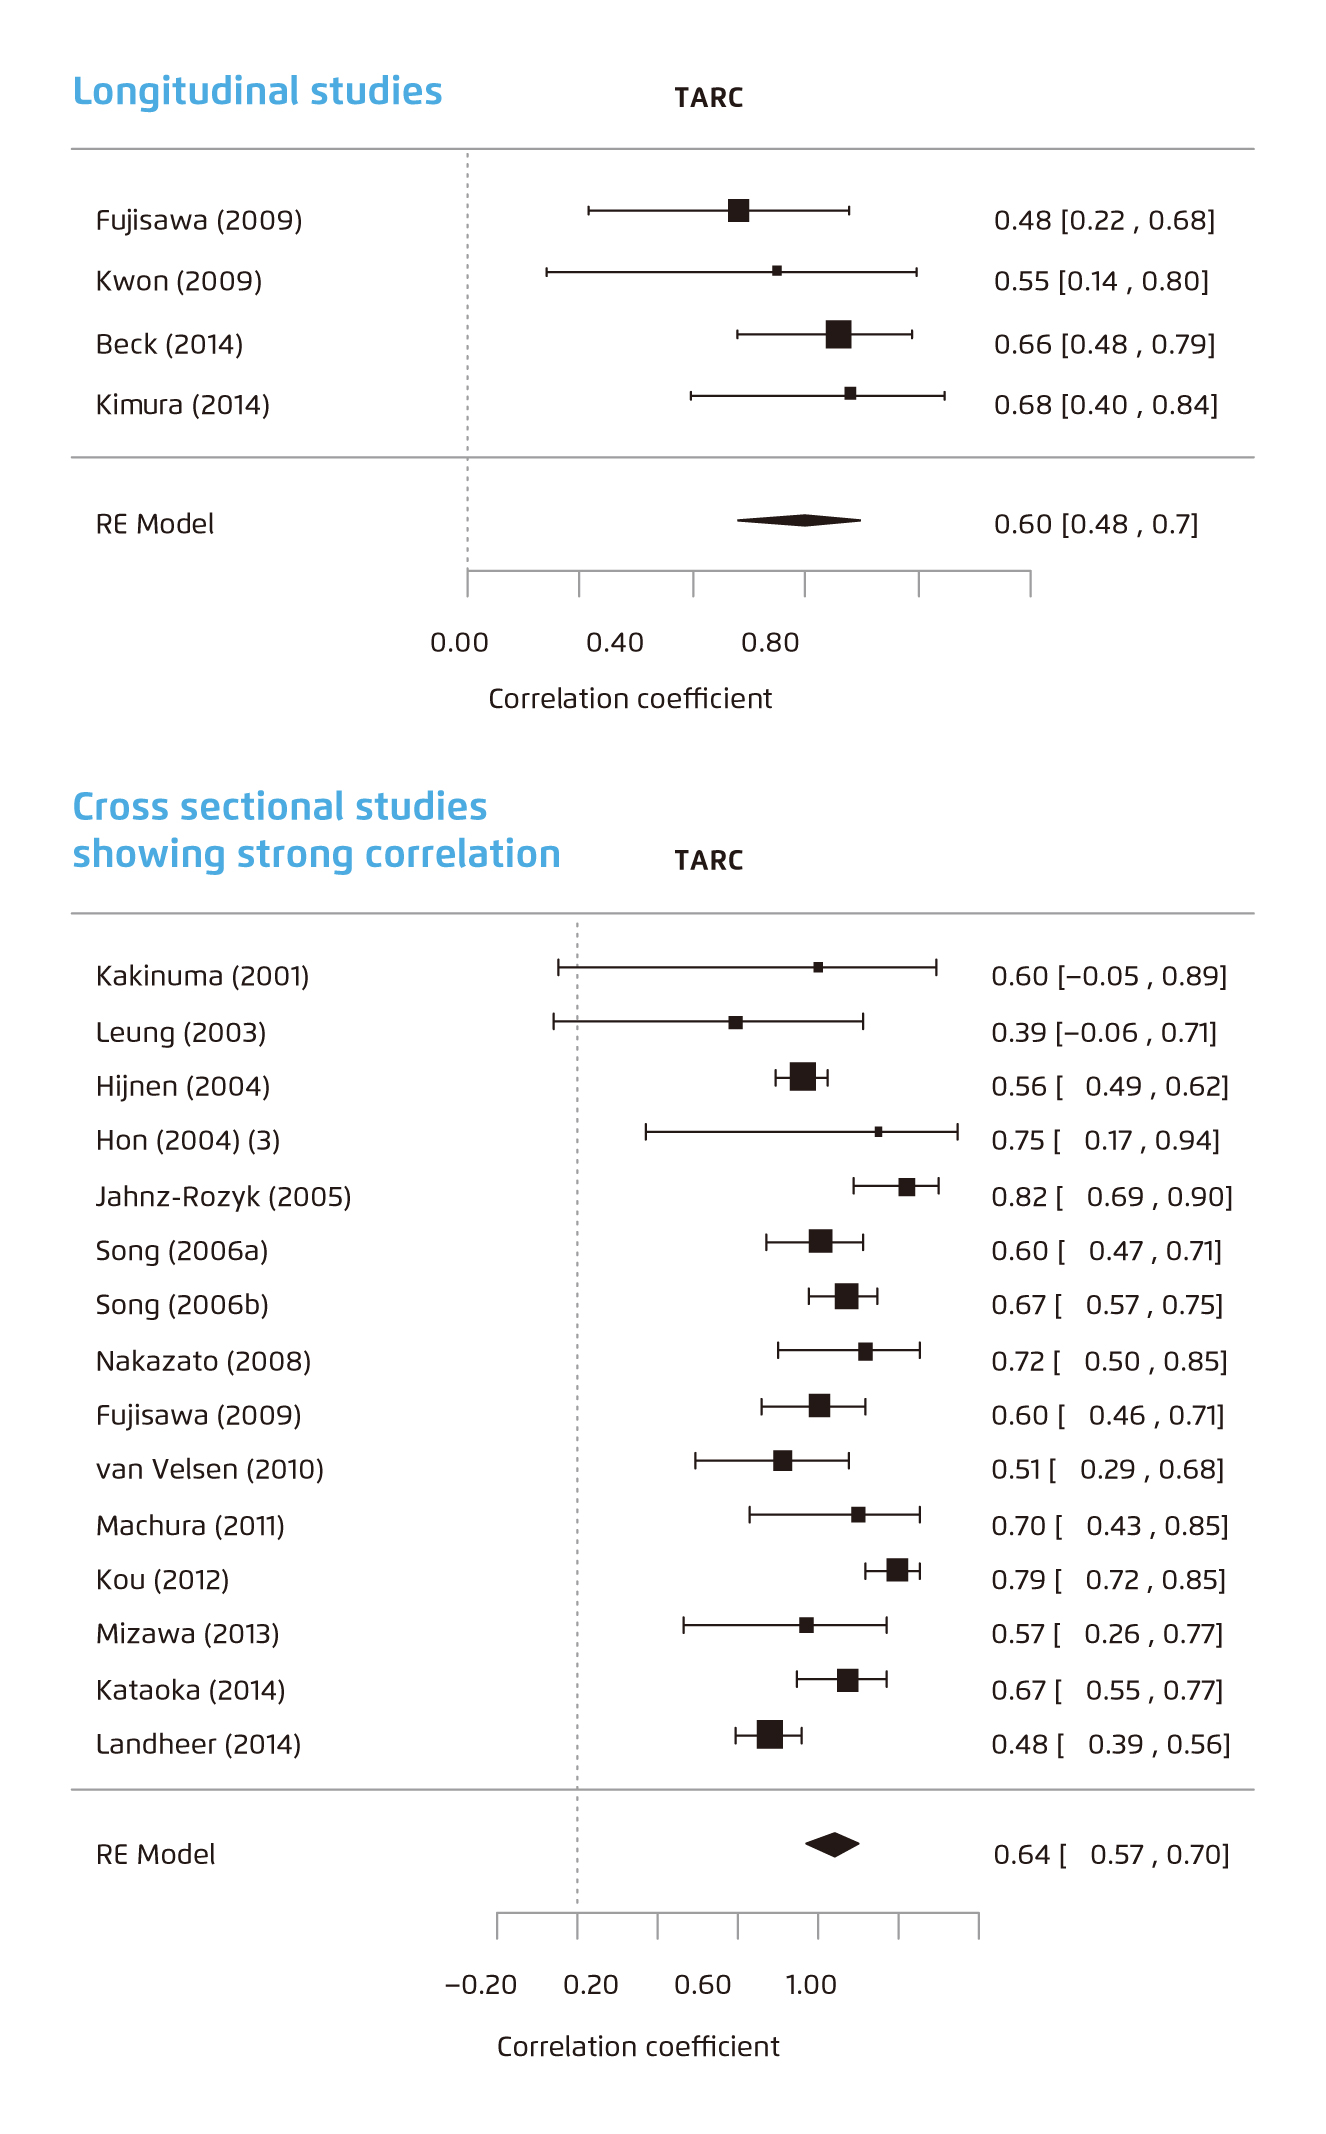
Figure 1. Forest plot of meta-analysis of longitudinal studies* (top) and cross-sectional studies† (bottom) for TARC8.
* Heterogeneity (I2) was 0%.
† Heterogeneity (I2) was 70%.
RE=random effects. TARC=thymus and activation-regulated chemokine.
In fact, testing TARC may not be a mere concept for clinical studies, as in Japan, commercial measurement of serum TARC levels have been available under health insurance support since 20083. In the Japanese population at least, TARC has already become a clinically practical biomarker for monitoring treatment efficacy and ensuring successful treatment outcomes3. It is thus plausible that, locally, testing for TARC levels could also become part of the standard examination of AD patients.
Addressing AD Heterogeneity: The Robustness of Biomarker Panel
While TARC correlates with disease activity in individual patients during follow-up, TARC levels vary among cross-sectional cohorts of patients who share similar disease severity score, possibly due to the heterogeneity of AD that involves a multitude of biologic pathways9,10.
Similarly in clinical observations, some patients with severe AD have unexpectedly normal serum TARC levels, while some with mild to moderate disease have conversely high TARC levels9. Hence, using TARC alone in this subset of patients may not be suitable9.
Addressing this limitation, Thijs et al. alternatively explored the use of a panel of biomarkers9. In her study, the five-parameter multivariate signature that included 4 different biomarkers, TARC, pulmonary and activation-regulated chemokine (PARC), interleukine-22 (IL-22), and soluble interleukin-2 receptor (sIL-2R), and an additional demographic factor, gender, showed a disease severity correlation coefficient of 0.856, whereas that for the individual biomarkers ranged from 0.415 to 0.7429.
Subsequently, Thijs et al. performed another prospective study validating the uses of such biomarker panels10. With 65 AD patients and 32 potentially meaningful biomarkers analysed, a linear mixed model using a triple biomarker combination of TARC, IL-22 and sIL-2R that predicted the Eczema Area and Severity Index (EASI) scores (p-EASI) at different time points was developed (Figure 2)10. The predicted formula-derived EASI score showed a sensitivity of 100% and a specificity of 88.9%. When repeating the analysis 5 more times for the same model built from different sets of randomly selected AD subjects, a consistently high predictability was maintained across repetitions, showing a sensitivity ranging from 83.3% to 100.0% and a specificity ranging from 88.5% to 95.2%10.
Such prediction algorithm not only provides a single, consolidated value correlating to disease severity that saves the needs of separate interpretations of individual markers, but also serves as a reliable and objective AD severity monitoring tool10.
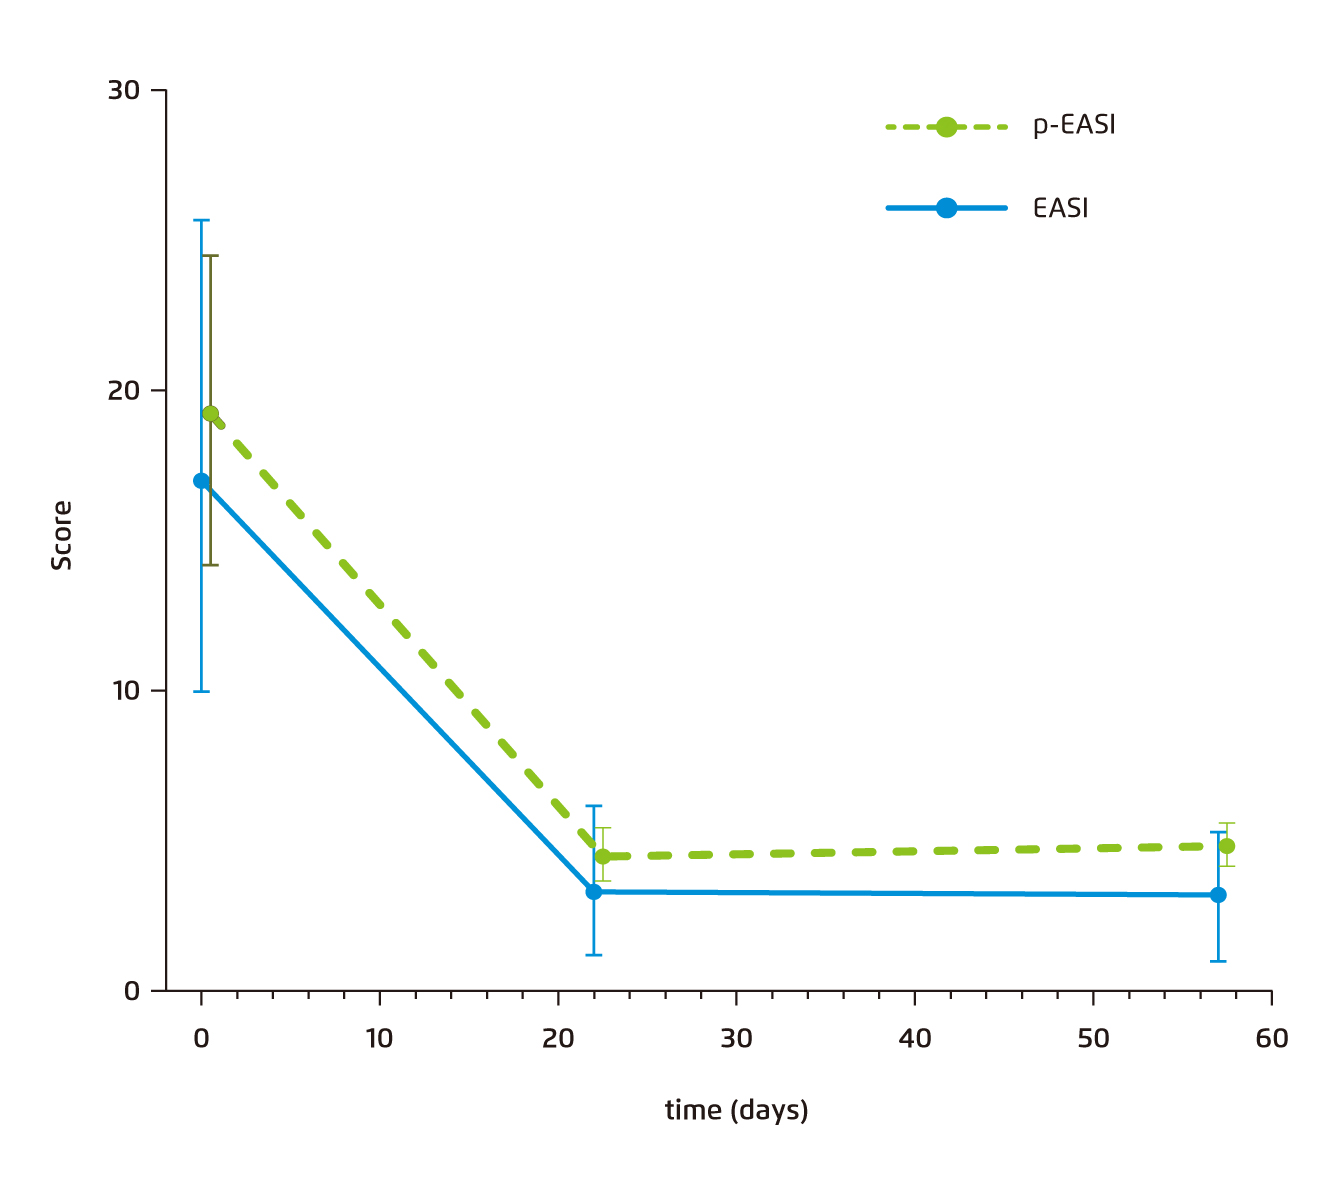
Figure 2. Median p-EASI and clinician-rated EASI scores of the 65 patients from the prospective AD cohort*10.
* Error bars represent 95% CIs. Serum TARC, IL-22, and sIL-2R levels are used to calculate p-EASI scores before and after treatment.
AD=atopic dermatitis. CI=confidence interval. EASI=Eczema Area and Severity Index. IL=interleukine-22. p-EASI=predicted Eczema Area and Severity Index. sIL-2R=soluble interleukin-2 receptor. TARC=thymus and activation-regulated chemokine.
Squamous Cell Carcinoma Antigens: Another Emerging and Promising Surrogate
TARC aside, squamous cell carcinoma antigens (SCCAs) have recently emerged as another novel biomarker for diagnosing AD11. Used initially as tumour markers for squamous cell carcinomas, SCCA 1 and 2 have been demonstrably involved in the pathogenesis of various inflammatory diseases, including AD11.
The usefulness of SCCA 1 and 2 in AD diagnosis had been evaluated in a study from Ohta, et al., showing that serum SCCA 1 and 2 concentrations were significantly elevated in AD patients (n=188) compared with control subjects (n=44) (SCCA 1: 2.9±2.4 vs 0.8+0.2 ng/mL; SCCA 2: 3.2+5.6 vs 0.6+0.2 ng/mL)12. Moreover, both serum SCCA 1 and SCCA 2 showed a significantly positive correlation with skin eczema severity, being reflective of the degree of skin eruption (Figure 3)12.
When performing receiver operating characteristic analyses to determine the cut-off values for AD diagnosis, the optimal cut-off values of SCCA 1 and SCCA 2 for AD diagnosis were 1.1 and 1.0 ng/mL, respectively, yielding specificities of 86% (SCCA 1) and 88% (SCCA 2) and a sensitivity of 86% (SCCA1 and SCCA2)12. Comparing with TARC, SCCA1 and SCCA2 detection systems even showed superior sensitivity and comparable specificity (Figure 4)12.
While SCCA 1 and 2 were also elevated in cervical cancer patients, the calculated SCCA2/SCCA1 ratio at a cut-off value of 0.9 demonstrated an 87% for both specificity and sensitivity, making the SCCA2/SCCA1 ratio capable to clearly distinguish the elevated SCCA conditions among AD and cervical cancer patients (Figure 4)12.
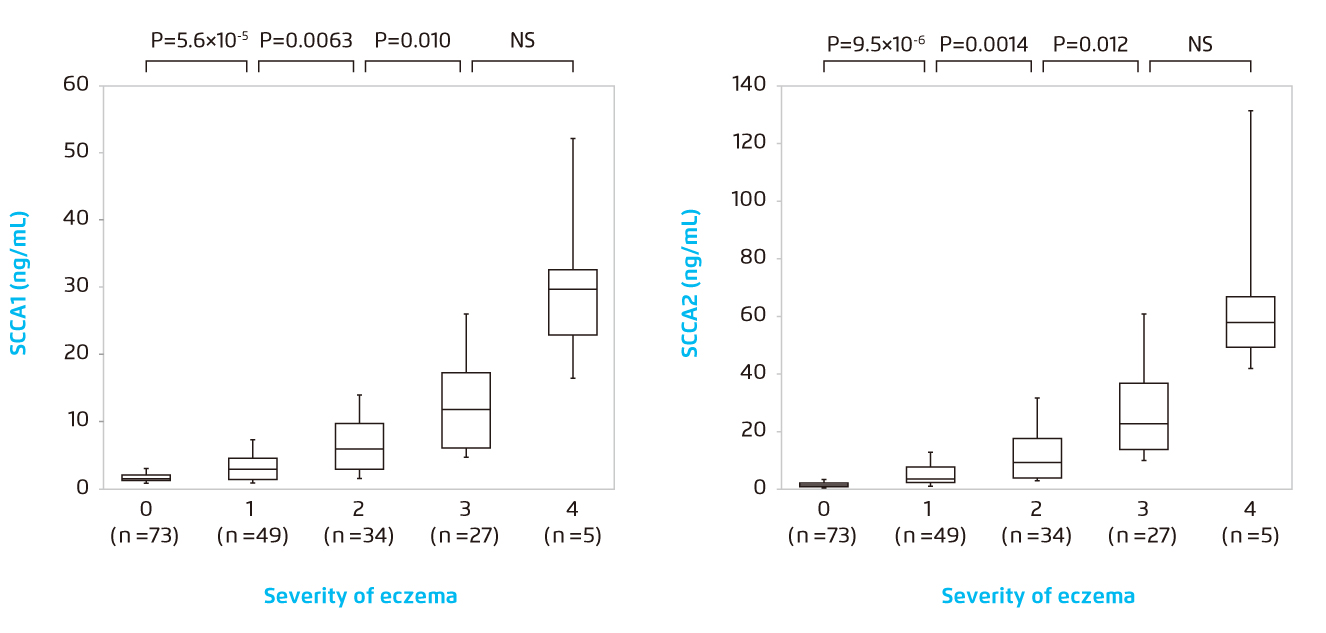
Figure 3.
Correlation of serum concentrations of SCCA 1 (left) or SCCA 2 (right) with eczema grades 0-4*12.
* The bottoms and tops of the boxes, and the bottom ends of the lower whiskers, and the top ends of the upper whiskers represent the 25th, 75th, 10th and 90th percentiles, respectively. The transverse lines in the boxes are the median values.
NS=non-significant. SCCA=squamous cell carcinoma antigen.
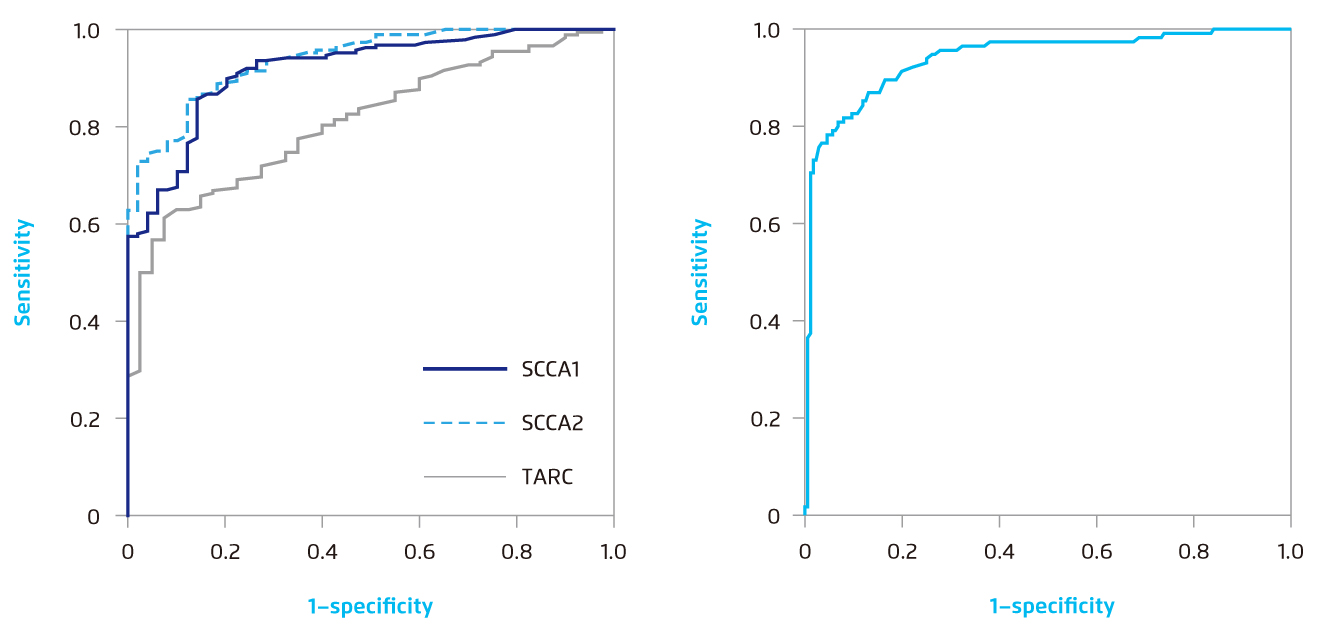
Figure 4.
(Left) ROC curves for serum SCCA 1, SCCA 2 or TARC concentrations to distinguish AD patients from control donors*. (Right) The ROC curve for the SCCA 2/SCCA 1 ratio to distinguish active AD patients (grades 1-4) from cervical cancer patients†12.
*The AUCs were 0.92, 0.94 and 0.81 for SCCA 1, SCCA2 and TARC, respectively. The optimal cut-off values between AD patients and control donors are 1.2, 1.0 and 1.0 ng/mL based on the Youden index.
†The AUC is 0.94. The optimal cut-off value between active AD patients and cervical cancer patients is 0.9 based on the Youden index.
AD=atopic dermatitis. AUC=areas under the ROC curve. ROC=receiver operating characteristic. SCCA=squamous cell carcinoma antigen. TARC=thymus and activation-regulated chemokine.
Beyond the Numbers: A Clinical Tool for Improving Treatment Adherence
As the biomarker level could act as a numerical, yet objective mirror reflection of patients’ disease activity, it stands to reason that when patients get to see their biomarker levels decline prominently while on therapy, they would be motivated to continuously adhere to their regimen in order to maintain such positive outcomes3.
Besides, AD’s symptoms being nonvisible or subclinical with abnormally elevated biomarker levels could signal impending and likely relapses, which could be a justification of introducing early aggressive treatments and reinforcing treatment adherence further3. Without these clinical surrogates unearthing implicit disease progression, early proactive or prophylactic treatment interventions would likely be neglected or delayed, thus leaving room for diseases to silently develop in a malicious way.
Collectively, a combination approach leveraging the conventional clinical assessment and the novel biomarker diagnostics could undoubtedly optimize the patient care experience in AD.
References
1. Weidinger S, et al. Dermatol Ther. 2021;e15259. 2. Wollenberg A, et al. J Eur Acad Dermatol Venereol. 2021:10.1111/jdv.17167. 3. Renert-Yuval Y, et al. J Allergy Clin Immunol. 2021;147:1174-1190. 4. Patruno C, et al. G Ital Dermatol Venereol. 2020;155:1-7. 5. Nakamura T, et al. Br J Dermatol. 2019;181:1272-1279. 6. Patrizi A, et al. J Dermatolog Treat. 2021;27:1-7. 7. Leung TN, et al. Hong Kong J Paediatr. 2021;26:42-57. 8. Thijs J, et al. Curr Opin Allergy Clin Immunol. 2015;15:453-460. 9. Thijs JL, et al. Clin Exp Allergy. 2015;45:698-701. 10. Thijs JL, et al. J Allergy Clin Immunol. 2017;140:1703-1705. 11. Izuhara K, et al. Int J Mol Sci. 2018;19:1102. 12. Ohta S, et al. Ann Clin Biochem. 2012;49:277-284.